Harmonic patterns are intricate technical analysis tools that leverage Fibonacci numbers to identify potential reversal points in financial markets. These patterns are founded on the premise that price movements are not random but follow a natural harmonic rhythm reflected in Fibonacci ratios. This guide will delve into what harmonic patterns are, their types, how to identify them, and their application in trading strategies.
Understanding Harmonic Patterns:
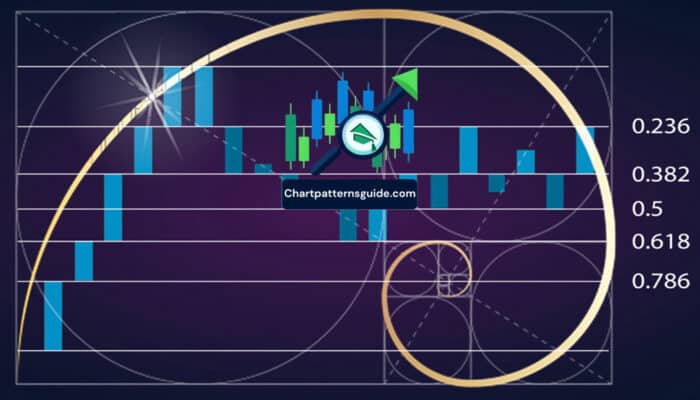
Harmonic patterns are based on the discovery that price movements echo the Fibonacci sequence, a series of numbers where each number is the sum of the two preceding ones. This sequence is fundamental in various natural phenomena and, intriguingly, in financial markets. Harmonic patterns use these Fibonacci ratios to predict future price movements by identifying specific structures in price charts.
Key Principles of Harmonic Patterns:
- Fibonacci Ratios: The most critical aspect of harmonic patterns. Ratios like 0.618 (also known as the Golden Ratio), 0.382, and 1.618 are used to predict retracement and projection levels.
- Pattern Structure: Each harmonic pattern has a unique structure made up of specific Fibonacci retracements and extensions.
- Reversal Points: Harmonic patterns help traders identify potential reversal points in the market, offering opportunities to enter or exit trades.
Common Types of Harmonic Patterns:
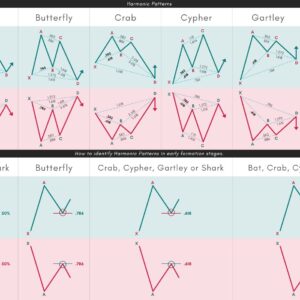
- Gartley Pattern: The Gartley pattern, or ‘Gartley 222’, is one of the oldest harmonic patterns. It is identified by an ‘M’ shape in uptrends and a ‘W’ shape in downtrends, signaling potential reversals.
- Butterfly Pattern: This pattern resembles the Gartley pattern but with wider wings. It indicates a stronger reversal signal compared to the Gartley.
- Bat Pattern: The Bat pattern is distinct with its precise Fibonacci levels, offering high accuracy in predicting market reversals. It’s characterized by an ‘XABCD’ structure, with varying Fibonacci ratios defining each leg.
- Crab Pattern: Known for its extreme potential reversal zones, the Crab pattern provides precise entry points, thanks to its use of the 1.618 Fibonacci extension.
- Shark Pattern: The Shark pattern, identified by its steep price moves and specific Fibonacci ratios, signals strong reversals and potential for significant profits.
Identifying and Trading Harmonic Patterns:
- Pattern Identification: The first step is to identify potential harmonic patterns on price charts. This involves recognizing the specific ‘XABCD’ structures and applying Fibonacci retracement and extension tools to verify the pattern’s validity.
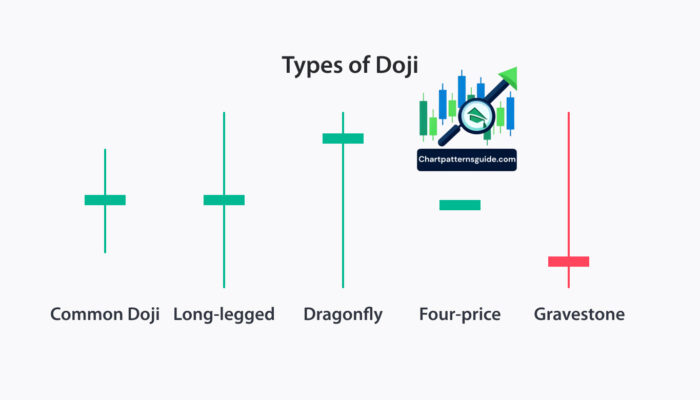
- Confirmation: Before entering a trade based on a harmonic pattern, look for additional confirmation signals such as oscillators divergence, volume analysis, or candlestick patterns indicating a reversal.
- Entry and Exit Points: Harmonic patterns provide clear entry points at the completion of the final leg (‘D’ point). Stop-loss orders are typically placed just beyond the pattern’s furthest extremity. Profit targets are often set at previous resistance (in a bullish pattern) or support levels (in a bearish pattern).
Advanced Considerations:
- Timeframes: Harmonic patterns can be identified across various timeframes, but they tend to be more reliable on longer timeframes (4-hour, daily, or weekly charts).
- Risk Management: Due to the precision of harmonic patterns, they allow for tight risk management. However, no strategy guarantees success 100% of the time, so proper risk management rules should always be followed.

