

Doji Candlesticks signal crucial moments of hesitation in the financial markets, often indicating potential reversals or continuations in price trends. Characterized by their distinct lack of a significant body, these patterns serve as a visual representation of a balance between buying and selling forces within a trading session. Understanding Doji Candlesticks is essential for traders aiming to grasp the underlying market sentiment and make informed decisions based on technical analysis.
In the vast expanse of the financial markets, each trading day is narrated through the language of candlesticks, with one pattern standing out for its depiction of equilibrium and hesitation – the Doji candlestick. This quintessential symbol of market indecision is not merely a pause in the cacophony of buying and selling but a moment of clarity that, if interpreted correctly, can unveil impending shifts in market momentum. This comprehensive guide delves into the world of Doji candlesticks, offering traders an all-encompassing view of how to interpret, leverage, and strategize around market indecision for optimal trading outcomes.
Triple Top and Bottom Patterns: Mastering Reversal Strategies
Exploring the Doji Candlestick

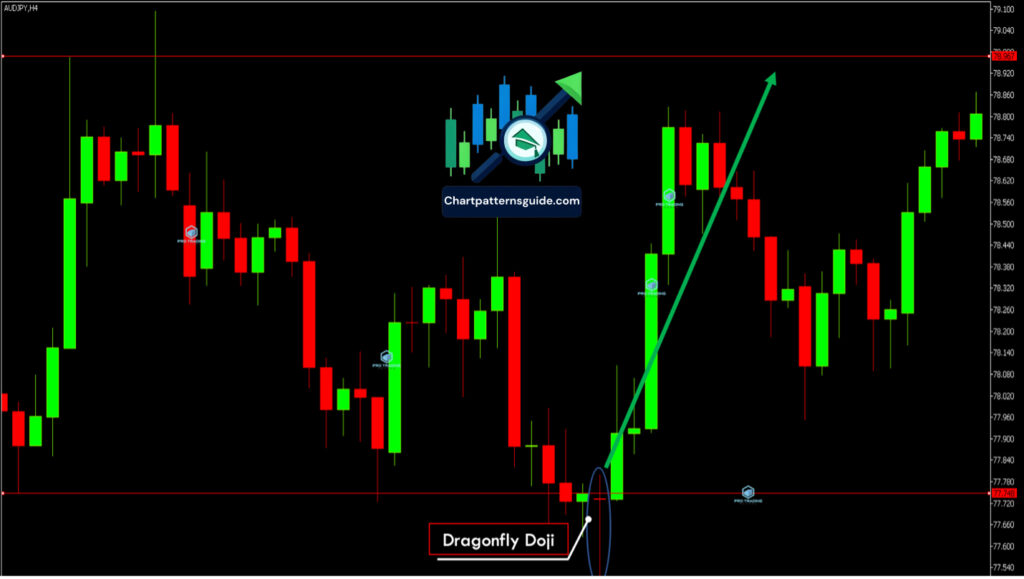
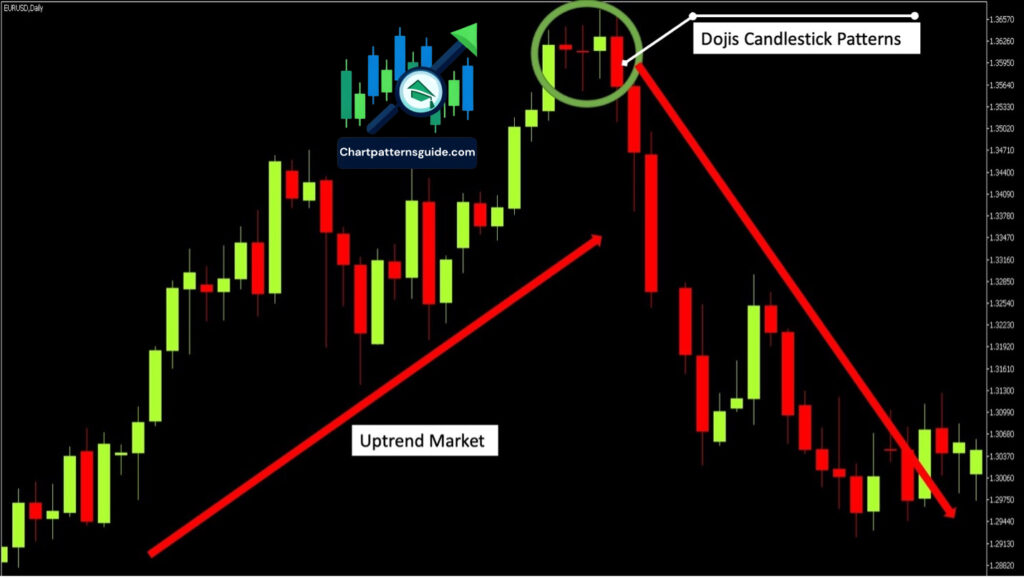
At its core, the Doji candlestick is a representation of a market in balance. The open and close prices of a Doji are the same or nearly the same, producing a candle with a small or nonexistent body. This simplicity belies its analytical depth, signaling a tug-of-war between buyers and sellers where neither side gains ground. Variations of the Doji, including the Classic, Long-Legged, Dragonfly, and Gravestone, each add a layer of nuance to interpreting market sentiment and potential reversals.
The Strategic Significance of Doji Patterns

The occurrence of a Doji within a prevailing trend is akin to a whisper in a storm, signaling that the current momentum may be losing its conviction. Trading strategies around Doji patterns hinge on this pivotal moment of indecision. Properly identifying and reacting to Dojis can enable traders to anticipate reversals or continuations in the trend. However, the true power of Doji candlesticks is unlocked when combined with other technical analysis tools, such as trend lines, volume, and additional candlestick patterns, to confirm the market’s direction.
Application in Real-World Trading
Practical application of Doji candlesticks extends beyond mere recognition. In volatile markets, the Doji serves as a harbinger of potential change, guiding traders in adjusting their positions, setting stop-losses, and identifying entry points. Case studies of the Doji’s predictive accuracy across various asset classes underscore its versatility and effectiveness. These real-world examples provide a blueprint for traders to integrate Doji patterns into their market analysis and trading strategies.
Navigating the Pitfalls
Despite their utility, Doji patterns are not without their challenges. False signals and the need for confirmation underscore the importance of a disciplined approach to trading Dojis. This section addresses common pitfalls and how to mitigate them, emphasizing the need for a comprehensive market analysis framework that incorporates Doji candlesticks as one of many tools to decipher market sentiment.
The Doji candlestick, in its elegant simplicity, offers a lens through which to view the market’s underlying dynamics. Its presence is a call to attention for traders, a moment to reassess and strategize with the knowledge that the market’s next move could be imminent. This guide has aimed to equip traders with the knowledge to harness the power of Doji candlesticks, turning moments of indecision into opportunities for informed decision-making. In mastering the Doji, traders gain not just a technical indicator, but a deeper insight into the market’s soul.


