

One of the keys to success in financial markets is the ability to accurately interpret market behaviors. Harmonic patterns are among the effective methods used to predict potential reversal points in price movements. In this article, we focus on the “Butterfly Pattern,” a specific type of harmonic pattern, and explore how it can forecast market reversals.
MACD (Moving Average Convergence Divergence): The Ultimate Guide for Traders
What is the Butterfly Pattern?
The Butterfly Pattern is a harmonic pattern used in technical analysis to help identify potential reversals in the market. This pattern consists of four key legs: XA, AB, BC, and CD, each typically completing at specific Fibonacci levels.

Structure of the Pattern
- XA Leg: This initial move is the start of the trend, typically characterized by a significant rise or fall.
- AB Leg: This leg represents a correction of the XA leg and usually retraces up to 78.6% of XA.
- BC Leg: Emerging as a correction to the AB leg, it finishes anywhere between 38.2% to 88.6% of AB.
- CD Leg: The final leg, which projects the potential reversal, often extends to 161.8% to 224% of BC and ideally should be 127.2% to 161.8% of XA.
Identification and Trading
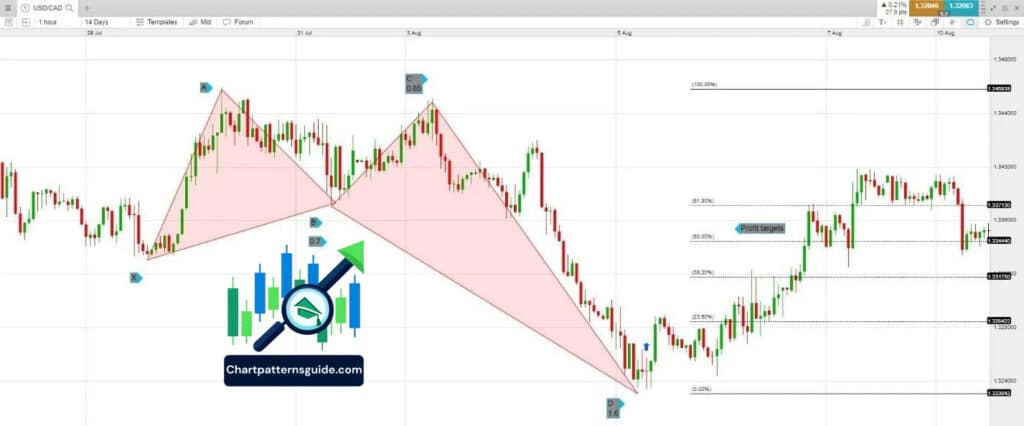
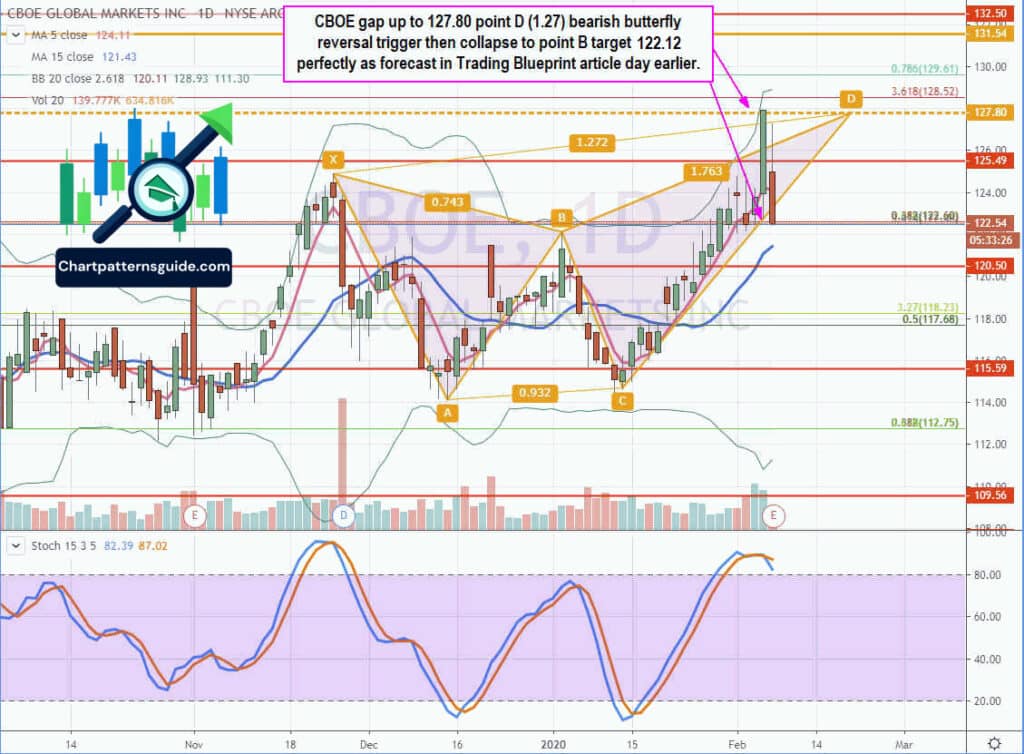
To effectively trade the Butterfly Pattern, traders must identify these legs accurately and observe the Fibonacci retracement levels closely. The pattern is considered complete when the price reaches the potential reversal zone (PRZ) at the end of the CD leg, signaling a high probability of market reversal.
How to Identify the Butterfly Pattern?
- Identify the initial move (XA): Look for a significant price movement, either upward or downward.
- Measure the retracement (AB): Use Fibonacci tools to ensure AB retraces to the correct level of XA.
- Observe the second retracement (BC): Confirm BC’s completion within the Fibonacci range of AB.
- Project the final leg (CD): Calculate CD using BC’s measurements to determine the potential reversal zone.
FAQs in “People Also Ask”
Q: How reliable is the Butterfly Pattern in predicting market reversals? A: The Butterfly Pattern, like all trading tools, is not infallible but can be highly reliable when combined with other technical indicators. Its effectiveness increases in markets known for their volatility and liquidity.
Q: Can the Butterfly Pattern be applied to all time frames? A: Yes, the Butterfly Pattern can be applied across different time frames, but it tends to be more reliable on longer time frames, such as daily or weekly charts.
Q: What should traders do once the Butterfly Pattern is identified? A: Traders should look for additional confirmation signals (like oscillators or candlestick patterns) before making trade decisions. Setting tight stop-loss orders near the completion point of the CD leg is also recommended to manage risks.
Conclusion
The Butterfly Pattern is a powerful tool in the arsenal of a technical trader, providing insights into potential market reversals. By understanding its structure and applying it carefully within the context of other market indicators, traders can enhance their ability to make informed trading decisions.
This comprehensive guide should serve as a strong foundation for understanding and applying the Butterfly Pattern in various trading scenarios, ensuring that traders have a robust strategy for navigating market trends and turning points.


