

Double Top Patterns: Predicting Market Reversals. In the ever-evolving tapestry of the financial markets, the ability to anticipate shifts in momentum is invaluable. Among the myriad technical analysis tools at the disposal of traders, the Double Top pattern stands out for its simplicity and efficacy in signaling potential bearish reversals. This pattern, recognizable by its ‘M’-shaped formation on the charts, has long been a beacon for traders looking to gauge the exhaustion of an upward trend. This comprehensive exploration of the Double Top pattern will delve into its structure, significance, and strategic application in trading, offering traders at all levels a robust framework for enhancing their market analysis and decision-making processes.
Applying Fibonacci Retracement Levels for Precision Trading: A Complete Guide
Understanding the Double Top Pattern
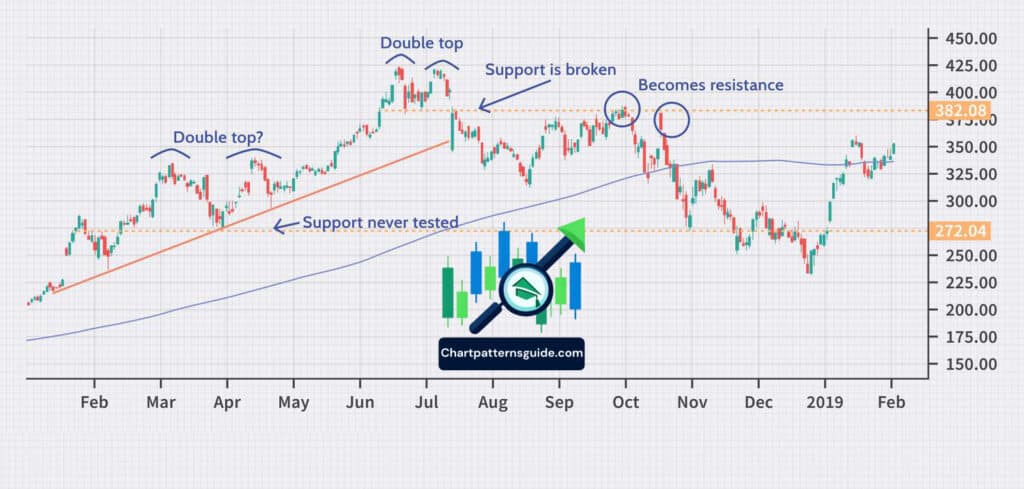
The Double Top pattern emerges on the price chart as two consecutive peaks approximately at the same level, separated by a trough, creating a visual representation reminiscent of the letter ‘M’. This formation is typically observed after a significant uptrend, signaling that the bullish momentum is waning and a potential reversal to a downtrend is imminent. The pattern is confirmed when the price falls below the support level—the neckline—formed at the bottom of the trough between the two peaks.
Diving deeper, the reliability of a Double Top pattern is often contingent upon several factors, including the time frame over which it develops, the volume during the formation of the peaks and the subsequent breakout, and the market context within which it occurs. The pattern’s effectiveness is enhanced when accompanied by an increase in selling pressure, evidenced by higher volume on the second peak’s decline and the eventual breakout below the neckline.
Trading Strategies Based on the Double Top Pattern
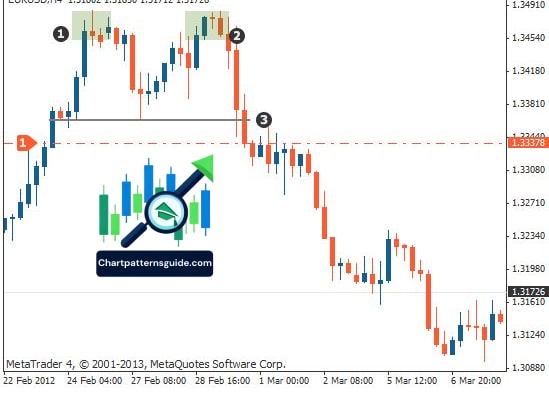
The strategic application of the Double Top pattern in trading revolves around precise entry, stop-loss, and profit target points. The conventional approach involves entering a short position once the price breaks below the neckline, signaling the pattern’s confirmation and the start of a new bearish trend.
To manage risk effectively, traders often place stop-loss orders just above the pattern’s highest peak. Profit targets can be determined by measuring the vertical distance from the peaks to the neckline and projecting this distance downward from the breakout point.
Advanced Considerations and Pitfalls
While the Double Top pattern is a powerful tool for predicting bearish reversals, traders must be wary of false signals and the pattern’s limitations. It is crucial to wait for full pattern confirmation before executing trades, as premature action can lead to misinterpretation of market movements. Integrating the Double Top pattern analysis with other technical indicators, such as the Relative Strength Index (RSI) or Moving Averages, can provide additional confirmation of the reversal and enhance the overall trading strategy.
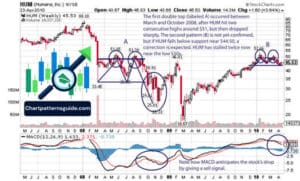
Case Studies and Real-World Application
Examining real-world examples of the Double Top pattern in action illuminates its practical utility in diverse market conditions. Historical case studies underscore the pattern’s predictive power, offering insights into its application across different asset classes, including stocks, forex, and commodities. These examples serve as a testament to the pattern’s versatility and reinforce the importance of contextual analysis in leveraging the Double Top pattern for trading success.
The Double Top pattern is a cornerstone of technical analysis, offering traders a clear signal of potential market reversals. Its simplicity, coupled with its potent predictive capabilities, makes it an indispensable tool in the trader’s arsenal. Mastery of the Double Top pattern, achieved through continuous study and application, empowers traders to navigate the complexities of the financial markets with greater confidence and strategic acumen. By incorporating this pattern into a comprehensive trading strategy, traders can significantly enhance their ability to identify high-probability trading opportunities and make informed decisions in the pursuit of their investment objectives.


