

The Fibonacci retracement tool is more than just a technical analysis instrument; it’s a bridge between the mathematical elegance of the Fibonacci sequence and the dynamic, often unpredictable world of trading. Originating from a sequence discovered by Leonardo Pisano Bigollo, also known as Fibonacci, in the 13th century, this tool has transcended its mathematical roots to become a cornerstone in the traders’ toolkit. By identifying key levels of support and resistance, Fibonacci retracement levels help traders anticipate potential reversal points in price action, offering a strategic edge in decision-making. This guide will navigate through the intricate workings of Fibonacci retracements, unveiling their practical utility in enhancing trading precision.
Leveraging Moving Averages for Trend Analysis: A Comprehensive Guide
The Essence of Fibonacci Retracement Levels

The journey into Fibonacci retracement levels begins with an understanding of the Fibonacci sequence itself—a series of numbers where each number is the sum of the two preceding ones. This sequence, with its unique properties, finds its expression in various natural phenomena, from the arrangement of leaves on a stem to the spirals of galaxies. In trading, the application of Fibonacci retracement levels involves dividing vertical distance between two extreme points (usually a major peak and trough) on the chart by the key Fibonacci ratios (23.6%, 38.2%, 50%, 61.8%, and sometimes 78.6%) to identify potential reversal points.
Implementing Fibonacci Retracement Levels in Trading
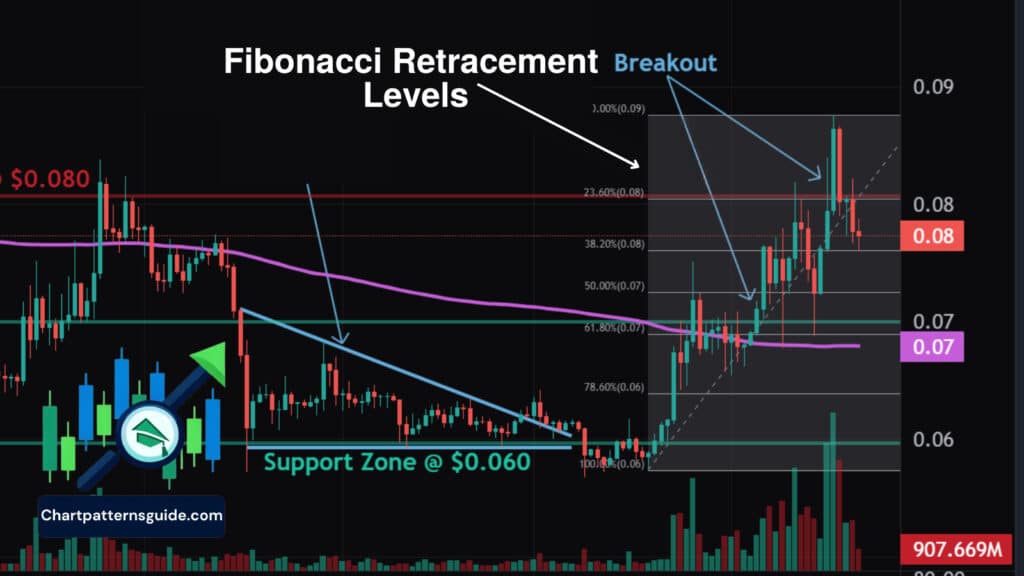
In practical terms, applying Fibonacci retracement levels to trading charts is a meticulous process that starts with identifying a significant price movement—from a high to a low or vice versa—and then applying the Fibonacci tool across this range. The resulting horizontal lines represent potential support and resistance levels where the price might pause or reverse. Traders closely monitor these levels, especially the golden ratio of 61.8%, as areas where market sentiment might shift, offering opportunities for entry or exit.
Strategic Trading with Fibonacci Retracement Levels

Crafting a trading strategy around Fibonacci retracement levels involves keen observation and patience. The first step is identifying clear bullish or bearish trends to apply the retracement levels effectively. Entry points are often considered near these Fibonacci levels, with additional confirmation from other indicators like moving averages or RSI to bolster the decision. Setting stop-loss orders slightly below or above the key Fibonacci levels can help manage risk, while profit targets might align with subsequent Fibonacci levels or previous support and resistance areas.
Advanced Techniques and Considerations
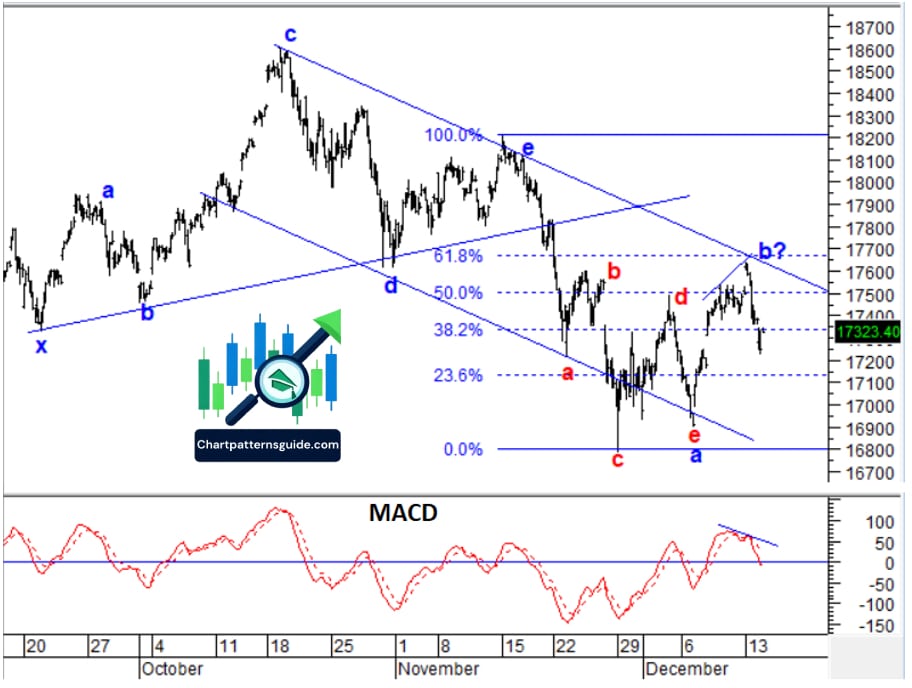
Beyond basic retracement, Fibonacci extensions and projections further refine prediction models, indicating where the price might head after breaking through initial retracement levels. Moreover, integrating Fibonacci retracement analysis with Elliott Wave Theory offers a comprehensive view of market cycles and potential turning points. However, traders must acknowledge the tool’s limitations, including the subjective nature of selecting start and end points for retracement application and the potential for self-fulfilling prophecy due to widespread use.
Fibonacci retracement levels embody the confluence of mathematical theory and market psychology, providing traders with a framework to anticipate and react to market movements. Mastery of Fibonacci retracements doesn’t come overnight but evolves through continuous application and experience. By weaving these levels into a broader analytical strategy, traders can navigate the markets with greater insight and confidence, turning the inherent uncertainty of trading into a landscape of opportunity.


