Candlestick patterns are foundational tools used in technical analysis, providing deep insights into market sentiment and potential price movements. Originating from Japan over 200 years ago, these patterns have become a crucial part of trading strategies in financial markets worldwide. This guide aims to demystify candlestick patterns for beginners, offering a detailed overview of how they work, how to interpret them, and how to apply this knowledge in trading.
What Are Candlestick Patterns?
Candlestick patterns are visual representations of price movements within a specified timeframe. Each candlestick displays the open, high, low, and close prices (OHLC) for a security or an index during a particular period. The main components of a candlestick are the “body” (the area between the opening and closing prices) and “wicks” or “shadows” (lines that protrude from the body, representing the high and low prices).
The Significance of Candle Colors:
- Bullish Candles: Typically colored green or white, indicate that the closing price was higher than the opening price.
- Bearish Candles: Usually colored red or black, show that the closing price was lower than the opening price.
Basic Candlestick Patterns:
- Single Candlestick Patterns:
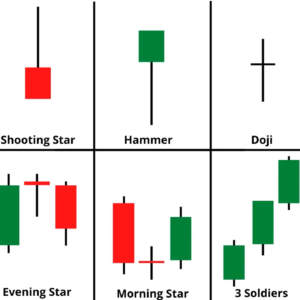
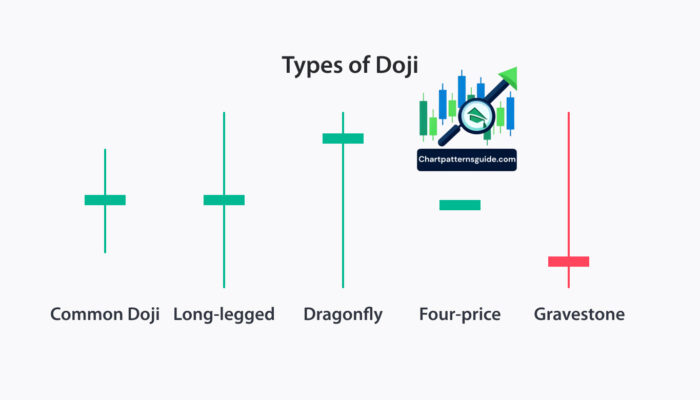
- Doji: Represents indecision in the market, where the opening and closing prices are virtually equal.
- Hammer: A bullish reversal pattern that occurs during a downtrend, characterized by a small body and a long lower wick.
- Shooting Star: A bearish reversal pattern that appears in an uptrend, featuring a small body and a long upper wick.
- Dual Candlestick Patterns:
- Bullish Engulfing: Occurs in a downtrend; the second candle completely engulfs the body of the first, signaling a potential reversal to an uptrend.
- Bearish Engulfing: Appears in an uptrend; the second candle completely engulfs the first candle’s body, indicating a possible downtrend.
- Triple Candlestick Patterns:
- Morning Star: A bullish reversal pattern appearing in a downtrend, consisting of a short-bodied candle between a long red and a long green candle.
- Evening Star: A bearish reversal pattern occurring in an uptrend, similar to the Morning Star but reversed, indicating a potential shift to a downtrend.
How to Interpret Candlestick Patterns:
Interpreting candlestick patterns involves understanding the underlying market psychology and sentiment. For instance, a Hammer pattern after a decline suggests that despite selling pressure, buyers managed to push the price back up, indicating potential buying interest. Conversely, a Shooting Star after an advance indicates selling pressure that could lead to a bearish reversal.
Applying Candlestick Patterns in Trading:
- Confirmation: Always wait for confirmation before acting on a pattern. For example, after a Bullish Engulfing pattern, look for additional bullish signals in the following sessions to confirm the reversal.
- Context: Consider the broader market context. Patterns are more significant when they align with other technical indicators or support/resistance levels.
- Practice: Use historical charts to practice identifying patterns and understanding their implications. Paper trading can also help apply this knowledge in a risk-free environment.

