

In the vast and dynamic world of technical analysis, the Moving Average Convergence Divergence (MACD) stands as a cornerstone indicator used by traders globally to gauge momentum, identify potential trend reversals, and signal entry and exit points. Developed by Gerald Appel in the late 1970s, MACD transcends its simple mathematical formula to become a versatile tool in the arsenal of those navigating the stock, forex, and commodities markets. This primer delves deep into the essence of MACD, exploring its components, calculation, and strategic application to provide traders with a comprehensive understanding of how to leverage this powerful indicator for improved market analysis and trading performance.
Triple Top and Bottom Patterns: Mastering Reversal Strategies
Decoding MACD: Components and Calculation
At its core, MACD is a momentum oscillator that thrives on the interplay between two moving averages of a security’s price. Understanding MACD begins with deciphering its primary components: the MACD line, the signal line, and the MACD histogram. Each component offers unique insights into market dynamics, from the momentum behind price movements to potential bullish or bearish divergences. Through detailed examples, this section will guide readers through the process of calculating MACD, highlighting the importance of the exponential moving averages (EMAs) of 12 and 26 periods, and how the subtraction of these EMAs forms the MACD line, while the signal line is derived as an EMA of the MACD line itself.
Applying Fibonacci Retracement Levels for Precision Trading: A Complete Guide
Strategic Applications of MACD in Trading

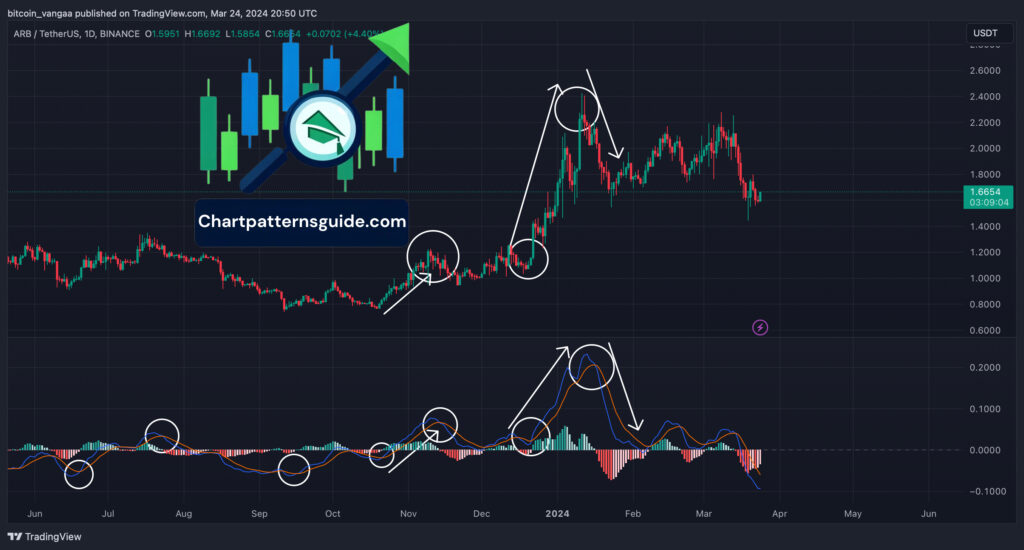
The real prowess of MACD lies in its application. This section would explore various strategies that leverage MACD for trading, from identifying trend reversals through MACD crossovers to recognizing momentum shifts with MACD divergence. Through careful analysis and strategic implementation, traders can use MACD to refine their trading strategies, employing the indicator to spot potential entry and exit points, and to gauge the strength of market trends. This part of the article would also discuss the role of the MACD histogram, a component that offers a visual representation of the difference between the MACD and signal lines, providing an additional layer of insight into market momentum.
Integrating MACD with Other Technical Analysis Tools
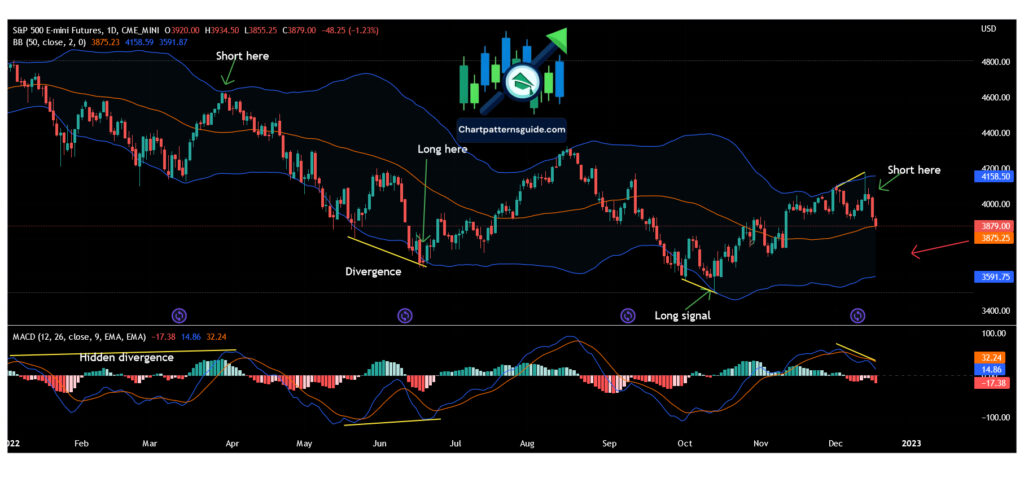

No indicator should be used in isolation, and MACD is no exception. This section would emphasize the importance of integrating MACD with other technical analysis tools for a more holistic market analysis. By combining MACD with indicators such as RSI, Stochastic Oscillator, or Bollinger Bands, traders can confirm signals and enhance their decision-making process. Real-world examples would illustrate how such integration can lead to more informed and confident trading decisions.
Common Pitfalls and Best Practices
Despite its numerous advantages, MACD is not immune to producing false signals. This section would address common pitfalls associated with MACD usage, such as lagging signals or overreliance on MACD in low volatility markets. Tips and best practices would be shared to help traders navigate these challenges effectively, including advice on signal confirmation, the importance of setting stop-loss orders, and the need for continuous learning and adaptation.
Navigating the Path to Trading Mastery: Essential Education & Tactical Approaches
The MACD indicator is a testament to the power of technical analysis, offering traders a nuanced tool for understanding market momentum and making informed trading decisions. This guide aims to provide traders with a deep understanding of MACD, from its foundational principles to its application in real-world trading scenarios. Armed with this knowledge, traders can confidently incorporate MACD into their technical analysis toolkit, enhancing their ability to navigate the complexities of the financial markets.
Have questions about MACD or any specific insights you’d like to discuss? Feel free to leave a comment below. We’re here to delve deeper into your queries and foster a community of informed traders. Your thoughts and questions are invaluable to us!


