

In the landscape of technical analysis, certain patterns emerge as beacons of potential market reversals, guiding traders through the tumultuous seas of market volatility. Among these, the Inverse Head and Shoulders pattern stands out as a herald of bullish sentiment, signaling a possible end to downtrends and the beginning of an upward ascent. This comprehensive guide delves deep into the anatomy of the Inverse Head and Shoulders pattern, its significance in forecasting bullish reversals, and strategies for leveraging this pattern to maximize trading success.
How to Trade the Head and Shoulders Pattern: The Ultimate Reversal Strategy Guide
Understanding the Inverse Head and Shoulders Pattern

At its core, the Inverse Head and Shoulders pattern is a reversal pattern that is traditionally formed at the end of a downtrend, paving the way for a potential bullish turnaround. Characterized by three troughs, with the middle trough (the head) being the deepest and the two others (shoulders) being shallower, this pattern is a mirror image of the more commonly known Head and Shoulders pattern, which signals bearish reversals.
Formation and Components
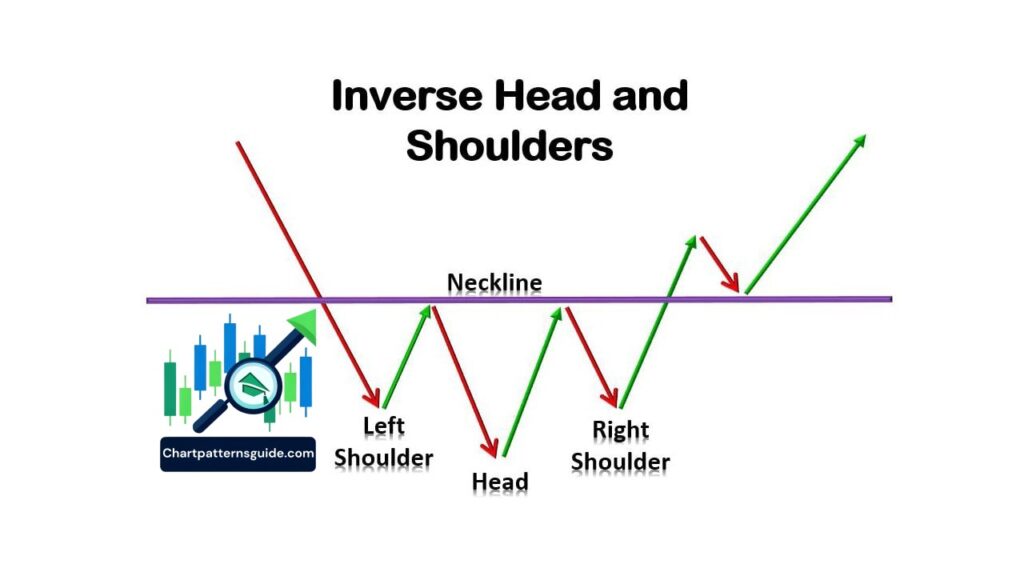
- First Shoulder: The pattern begins with the formation of the first shoulder, which emerges following a downtrend. This initial trough represents a temporary pause in the downward momentum, indicating that sellers are starting to lose control.
- Head: As selling pressure resumes, the price descends below the level of the first shoulder, forming the head. This lowest point signifies the climax of bearish momentum before buyers begin to step back in with more conviction.
- Second Shoulder: The formation of the second shoulder reflects a failed attempt by sellers to push the price to new lows. This higher low compared to the head indicates a weakening downtrend and a shift in market sentiment from bearish to bullish.
- Neckline: The key to confirming the Inverse Head and Shoulders pattern lies in the neckline, a resistance line drawn across the highs of the two shoulders. A breakout above this neckline is crucial for confirming the pattern and signaling a bullish reversal.
Significance and Interpretation
The Inverse Head and Shoulders pattern is revered among traders for its reliability in predicting bullish reversals. Its formation suggests a gradual shift in market dynamics, where bears lose their grip, and bulls begin to take charge, often leading to significant upward price movements. Technical analysts pay close attention to the volume accompanying each component of the pattern, as increasing volume on the breakout above the neckline further validates the reversal signal.
Trading Strategies Based on the Inverse Head and Shoulders Pattern

Leveraging the Inverse Head and Shoulders pattern for trading requires a strategic approach, focusing on entry points, stop-loss orders, and profit targets:
- Entry Point: The ideal entry point is upon a confirmed breakout above the neckline, preferably on higher-than-average volume. Traders often wait for a retest of the neckline as support before taking a position to ensure the validity of the breakout.
- Stop-Loss Orders: A prudent stop-loss strategy involves placing stop-loss orders just below the right shoulder or the neckline after the breakout, minimizing potential losses if the market reverses direction.
- Profit Targets: The projected upward move following the pattern’s completion can be estimated by measuring the distance from the bottom of the head to the neckline and extending that distance upward from the breakout point.
Case Studies and Real-World Application
To solidify understanding and application of the Inverse Head and Shoulders pattern, examining historical case studies where this pattern successfully signaled bullish reversals can be incredibly insightful. Analyzing these instances provides practical insights into pattern recognition, execution of trade setups, and risk management strategies that align with market realities.


